This script will assist in analyzing median home sales prices per county
if(!require(readr)) install.packages("readr", repos = "http://cran.us.r-project.org")
if(!require(dplyr)) install.packages("dplyr", repos = "http://cran.us.r-project.org")
if(!require(lubridate)) install.packages("lubridate", repos = "http://cran.us.r-project.org")
if(!require(tidyr)) install.packages("tidyr", repos = "http://cran.us.r-project.org")
if(!require(stringr)) install.packages("stringr", repos = "http://cran.us.r-project.org")
if(!require(ggplot2)) install.packages("ggplot2", repos = "http://cran.us.r-project.org")
if(!require(ggthemes)) install.packages("ggthemes", repos = "http://cran.us.r-project.org")

library(readr)
library(dplyr)
library(lubridate)
library(tidyr)
library(stringr)
library(ggplot2)
library(ggthemes)
#Clear current enviornment
rm(list = ls())

#Disable scientific notation
options(scipen=999)
Pull in data from https://www.zillow.com/research/data/
sales <- read.csv("http://files.zillowstatic.com/research/public/County/Sale_Prices_County.csv",
                  header = TRUE,
                  stringsAsFactors = FALSE)
Clean up the data
#Remove columns that I don't need
sales2 <- sales %>% select(-RegionID, -SizeRank)

#Gather the columns to make the dataset tidy, create a new column that will give us county and state, remove months
#that do not have sales data.
sales2 <- sales2 %>%
  gather(Month, Sales, 3:ncol(sales2)) %>%
  arrange(desc(Month))%>%
  mutate(CountyState= paste0(RegionName,", ",StateName), Sales= (Sales)) %>%
  filter(!is.na(Sales))

#Remove X from Month column name
sales2$Month <- str_replace(sales2$Month, "X", "")

#convert Month column from character to date.
sales2$Month <- ymd(sales2$Month, truncated = 2)
Type in your county
your_county <- "Los Angeles County, California" Line plot of your selected county
sales2 %>% filter(CountyState==your_county) %>% ggplot(aes(x=Month, y=Sales, group=1)) +
  geom_line() +
  geom_line(linetype = "dashed", color = "red") +
  ggtitle(your_county) +
  theme_economist()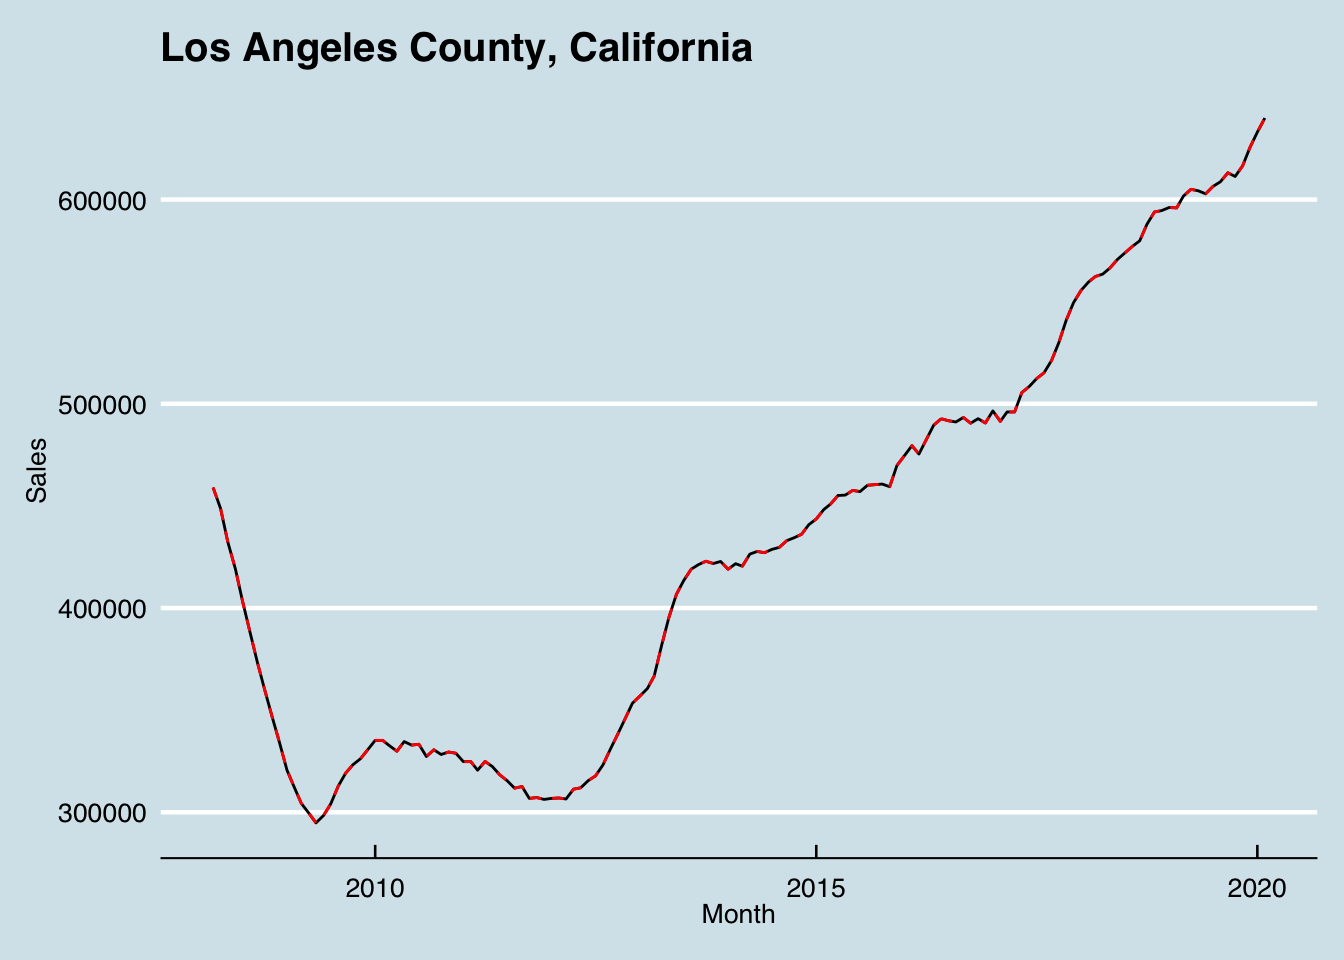
Your county in a table format
sales3 <- sales2 %>% filter(CountyState==your_county) %>% arrange(desc(Month))
head(sales3)
## RegionName StateName Month Sales
## 1 Los Angeles County California 2020-02-01 639900
## 2 Los Angeles County California 2020-01-01 633000
## 3 Los Angeles County California 2019-12-01 625400
## 4 Los Angeles County California 2019-11-01 616500
## 5 Los Angeles County California 2019-10-01 611300
## 6 Los Angeles County California 2019-09-01 613100
## CountyState
## 1 Los Angeles County, California
## 2 Los Angeles County, California
## 3 Los Angeles County, California
## 4 Los Angeles County, California
## 5 Los Angeles County, California
## 6 Los Angeles County, California